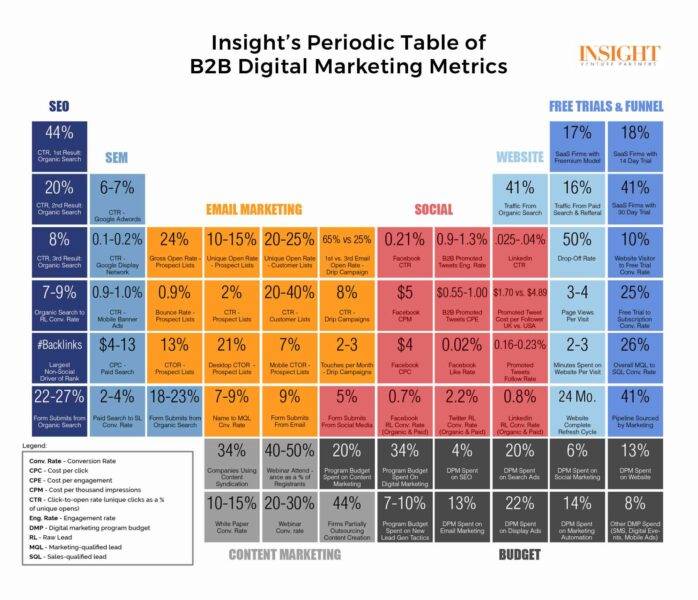
I’ve been thinking a lot about what marketing numbers we should track as a B2B company and how often you should look at them to achieve your desired results. Complexity is the enemy as it is very easy to include every possible Metric and end up in Key Performance Indicator (KPI) hell like this:

Time is the limiting factor. You can report the mess above in Google Data studio (or whatever tool you use) but your teams just don’t have the time to do the root analysis daily/weekly/monthly to course correct.
Spurred on by this great post by Aviniash, I’ve been thinking about what KPI pairs we want our marketing teams to look at in the context of daily/weekly/monthly/quarterly KPI’s/dashboards. My slight twist is that I want a leading Metric paired with an outcome Metric for us to track.
Daily KPI’s:
Sessions paired to Bounce Rate – Are we getting them to the site and the right place on the site?
Users paired to Avg Session Duration – Once they are here are they meaningfully engaged?

Weekly KPI’s:

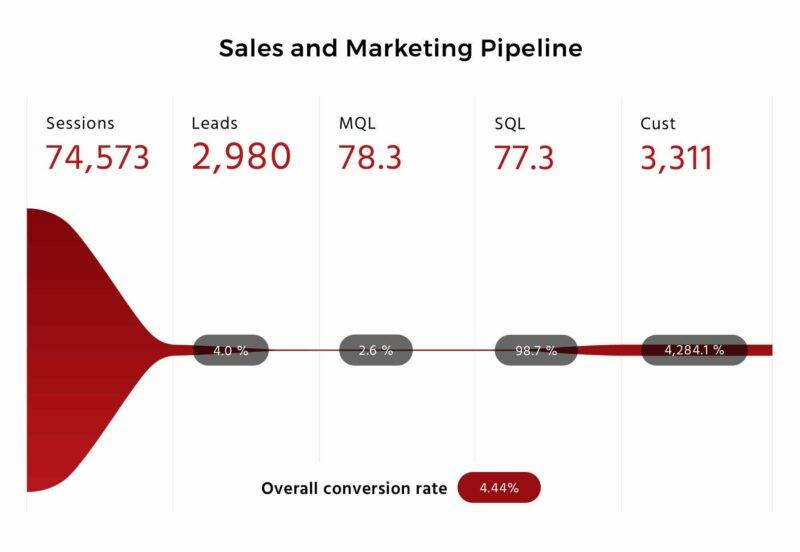
Weekly Sessions to Weekly Leads
# Marketing Qualified Leads – MQL’s are prospects that have raised their hand.
# Sales Qualified Leads – SQL’s are prospects that the sales team has reviewed and agreed that we can help them with our service offerings.
# Overall conversion rate to cost per MQL.
# Proposals paired to projected monthly Pipeline dollars.
Monthly KPI’s:
Pipeline dollars by Department paired to Revenue by Department.
Proposal conversion rate paired to New Monthly Recurring Revenue.
Quarterly KPI’s
MQL Conversion rate paired to Company Revenue.
New Monthly Recurring Revenue by Department.
We will see how these work out for our team and I will keep you updated on any changes we make as we move forward.
Resources
1. Occam’s Razon by Avinash Kaushik
2. Databox
3. Google Data Studio

